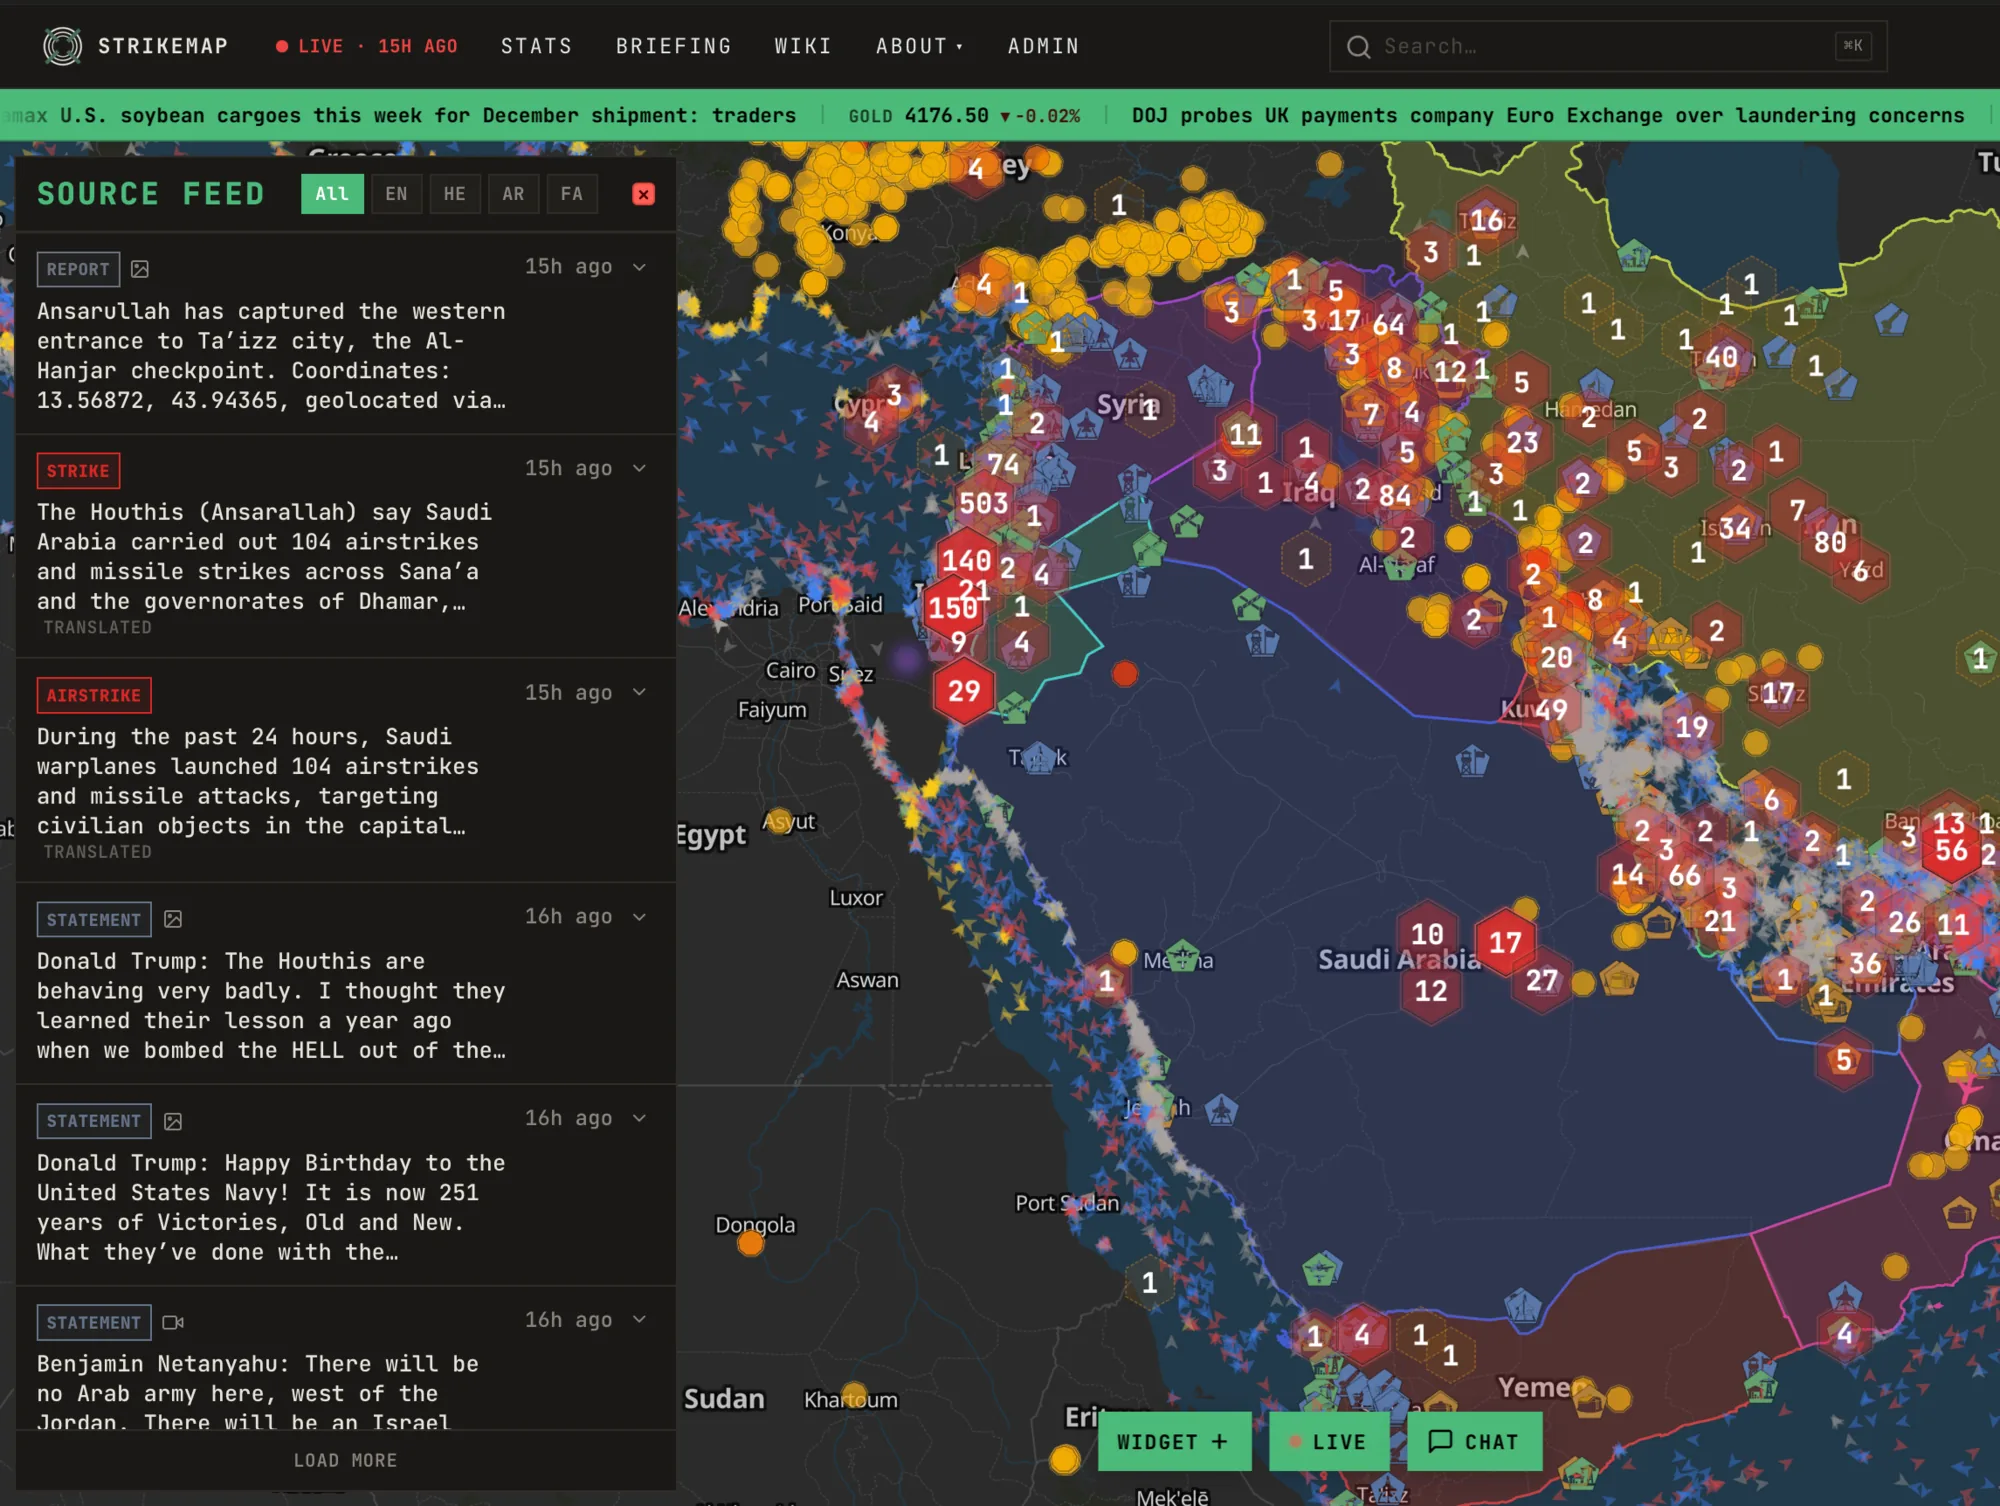
What it is
StrikeMap is a live map of conflict events. It fuses multilingual social-media reports, satellite thermals, missile alerts and maritime traffic into one view. It ran in production and served about 3,000 users, with around 500 at the same time at peak.
What I built
At its core is a conflict-domain ontology: a knowledge graph of more than 900 entities (actors, weapons, strategic sites) with a 47-class event taxonomy. Extraction, deduplication, geocoding and analytics all work against it.
On top of that sits a multimodal extraction pipeline. LLMs classify text, photo and video reports down the taxonomy and resolve entities against the graph. This surfaced near-verified events one to two hours before news media.
The data comes from Telegram (MTProto via mtcute), X streaming, NASA FIRMS satellite thermals, Tzofar missile alerts, NOTAM airspace notices and Datalastic maritime AIS. Thirteen specialised workers handle it behind PGMQ queues with configurable concurrency.
An enrichment stack on Google Gemini (our own enrich and gen-ai-tooling packages) pulls structured fields such as location, weapon type, casualties and damage out of free-text reports. DBSCAN clustering removes duplicates across sources.
To keep up with production load I used a sliding-window Upstash Redis rate limiter, batched workers, signed-URL caching, briefing deduplication and PGMQ for backpressure. The product also shipped Stripe-backed multi-tier subscriptions, role-based access control, and full RTL-aware i18n in English, Arabic, Hebrew and Persian.
The interesting problem
The interesting problem was reducing LLM token consumption. We started with a large model making big calls, and moved to what is basically a decision-tree architecture running on a smaller model.
That means more calls, but fewer tokens overall, and cheaper ones.